From Staff Reports and the St. John's River Water Management District
It sounds like something a fisherman off the coast of Maine might yell at his crew, rather than a weather forecaster from Florida.
"Batten down the hatches, a nor'easter is coming!"
Nor’easters are typically associated with snow in the Northeast, but the system that hit Florida last weekend brought cold temperatures and lots of rain. And while they are rare, nor’easters do sometimes impact the Sunshine State.
Over the weekend, a nor’easter event resulted in flooding throughout the District. Strong winds, heavy rain, and high tides created persistent flooding in the lower St. Johns River Basin. Rainfall totals ranged between 1 and 6 inches, with most areas getting between 2 and 4 inches.
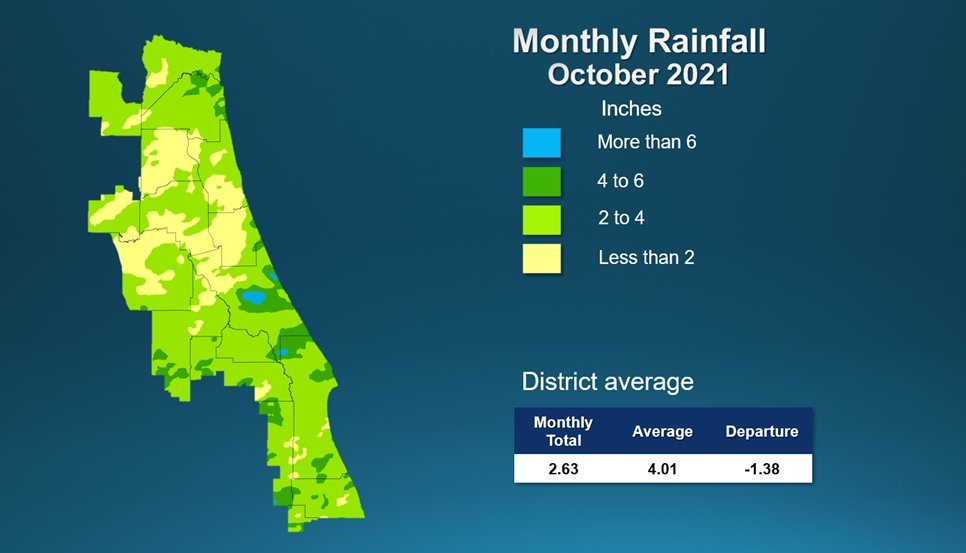
October
While it is still storm season around the St. Johns River Water Management District, October brought rainfall well below the long-term average.
A full report outlining October’s hydrologic conditions was presented at the District’s Governing Board meeting Tuesday. Highlights include:
Rainfall
- Districtwide, October rainfall averaged 2.63 inches, which is 1.38 inches below the long-term average for the month.
- Many counties only received roughly half the normal October rainfall, including Clay, St. Johns, Flagler, Putnam, Brevard, and Indian River.
- The County with the highest rainfall totals was Volusia, with 3.3 inches of rain
- The counties with the least rainfall in October were Clay, with only 1.6”, followed by Putnam and Flagler (1.9”), and St. Johns (2.0”).
- Districtwide, the cumulative rainfall total for the past 12 months is 50.92 inches, which is 0.09 inches below the long-term average.
Groundwater
- Upper Floridan aquifer conditions (groundwater levels) at the end of October were either in the high or normal range throughout the District. Water levels in many of the wells used for this report decreased more than 10 percentile points during the month.
- Groundwater levels are at the 82nd percentile Districtwide. This means that since 1980, aquifer levels have been higher than they currently are about 18 percent of the time.
Surface water flows
- On Nov. 1, flow in most stations across the District was in the average range. The exception was the St. Johns River at Melbourne station, which had flows in the low range, and the Econlockhatchee River at Chuluota station which exhibited high flow on Nov. 1.
- On Nov. 1, flow in the St. Johns River’s headwaters at the Melbourne station was 184 million gallons per day (mgd) (24th percentile).
- Flows in the Econlockhatchee River near Chuluota were in the high range at 278 mgd (86th percentile).
- Flows in the Wekiva River near Sanford were in the average range at 180 mgd (73rd percentile).
- Flows at the DeLand station were in the average range at 3,004 mgd (54th percentile).
- Flows in the Ocklawaha River, the largest tributary to the St. Johns River, were in the average range at 587 mgd (57th percentile).
- Flows at the St. Johns River near Satsuma station were in the average range at 3,845 mgd (38th percentile).
- Flows in the St. Marys River near Macclenny were in the average range at 159 mgd (75th percentile).
Lake levels
- Lake Brooklyn water levels decreased 0.1 feet to 101.0 feet in October.
- Lake Weir decreased by 0.2 feet to 53.6 feet.
- Lake Apopka decreased by 0.1 feet to 65.5 feet.
- Blue Cypress Lake levels increased to 22.7 feet, slightly below the regulation schedule for this time of year. Blue Cypress is also part of a system with water control structures that are operated by the District. During April and May, the regulation schedule levels drop in preparation for the summer wet season.
Spring flows
- The mean monthly flow at Silver Springs increased to 821 cubic feet per second (cfs), or 531 mgd, which is a 18 cfs increase from September’s mean.
- At the Blue Spring station in Volusia County, the mean monthly flow was 150 cfs, or 97 mgd.
- At Rock Springs, the monthly mean flow decreased 1 cfs to 64 cfs (41 mgd), which is in the high range for October.
- Mean monthly flow at Wekiwa Springs decreased slightly to 66 cfs (43 mgd), which is in the normal range for the time of year.
Over the weekend, a nor’easter event resulted in flooding throughout the District. Strong winds, heavy rain, and high tides created persistent flooding in the lower St. Johns River Basin. Rainfall totals ranged between 1 and 6 inches, with most areas getting between 2 and 4 inches.
To learn more about rainfall totals and other hydrologic data collected, visit sjrwmd.com.
Visit WaterLessFlorida.com for tips to help landscapes thrive while saving water and money. Watch the weather and wait to water during Florida’s summer rainy season. Follow the water conservation conversation at #sjrwmd #waterconservation #savewater.
The St. Johns River Water Management District staff are committed to ensuring the sustainable use and protection of water resources for the benefit of the people of the District and the State of Florida. The St. Johns River Water Management District is one of five districts in Florida managing groundwater and surface water supplies in the state. The District encompasses all or part of 18 northeast and east-central Florida counties. District headquarters are in Palatka, and staff also are available to serve the public at service centers in Jacksonville and Palm Bay.


Comments
No comments on this item Please log in to comment by clicking here